
How do you explain graphic facilitation?
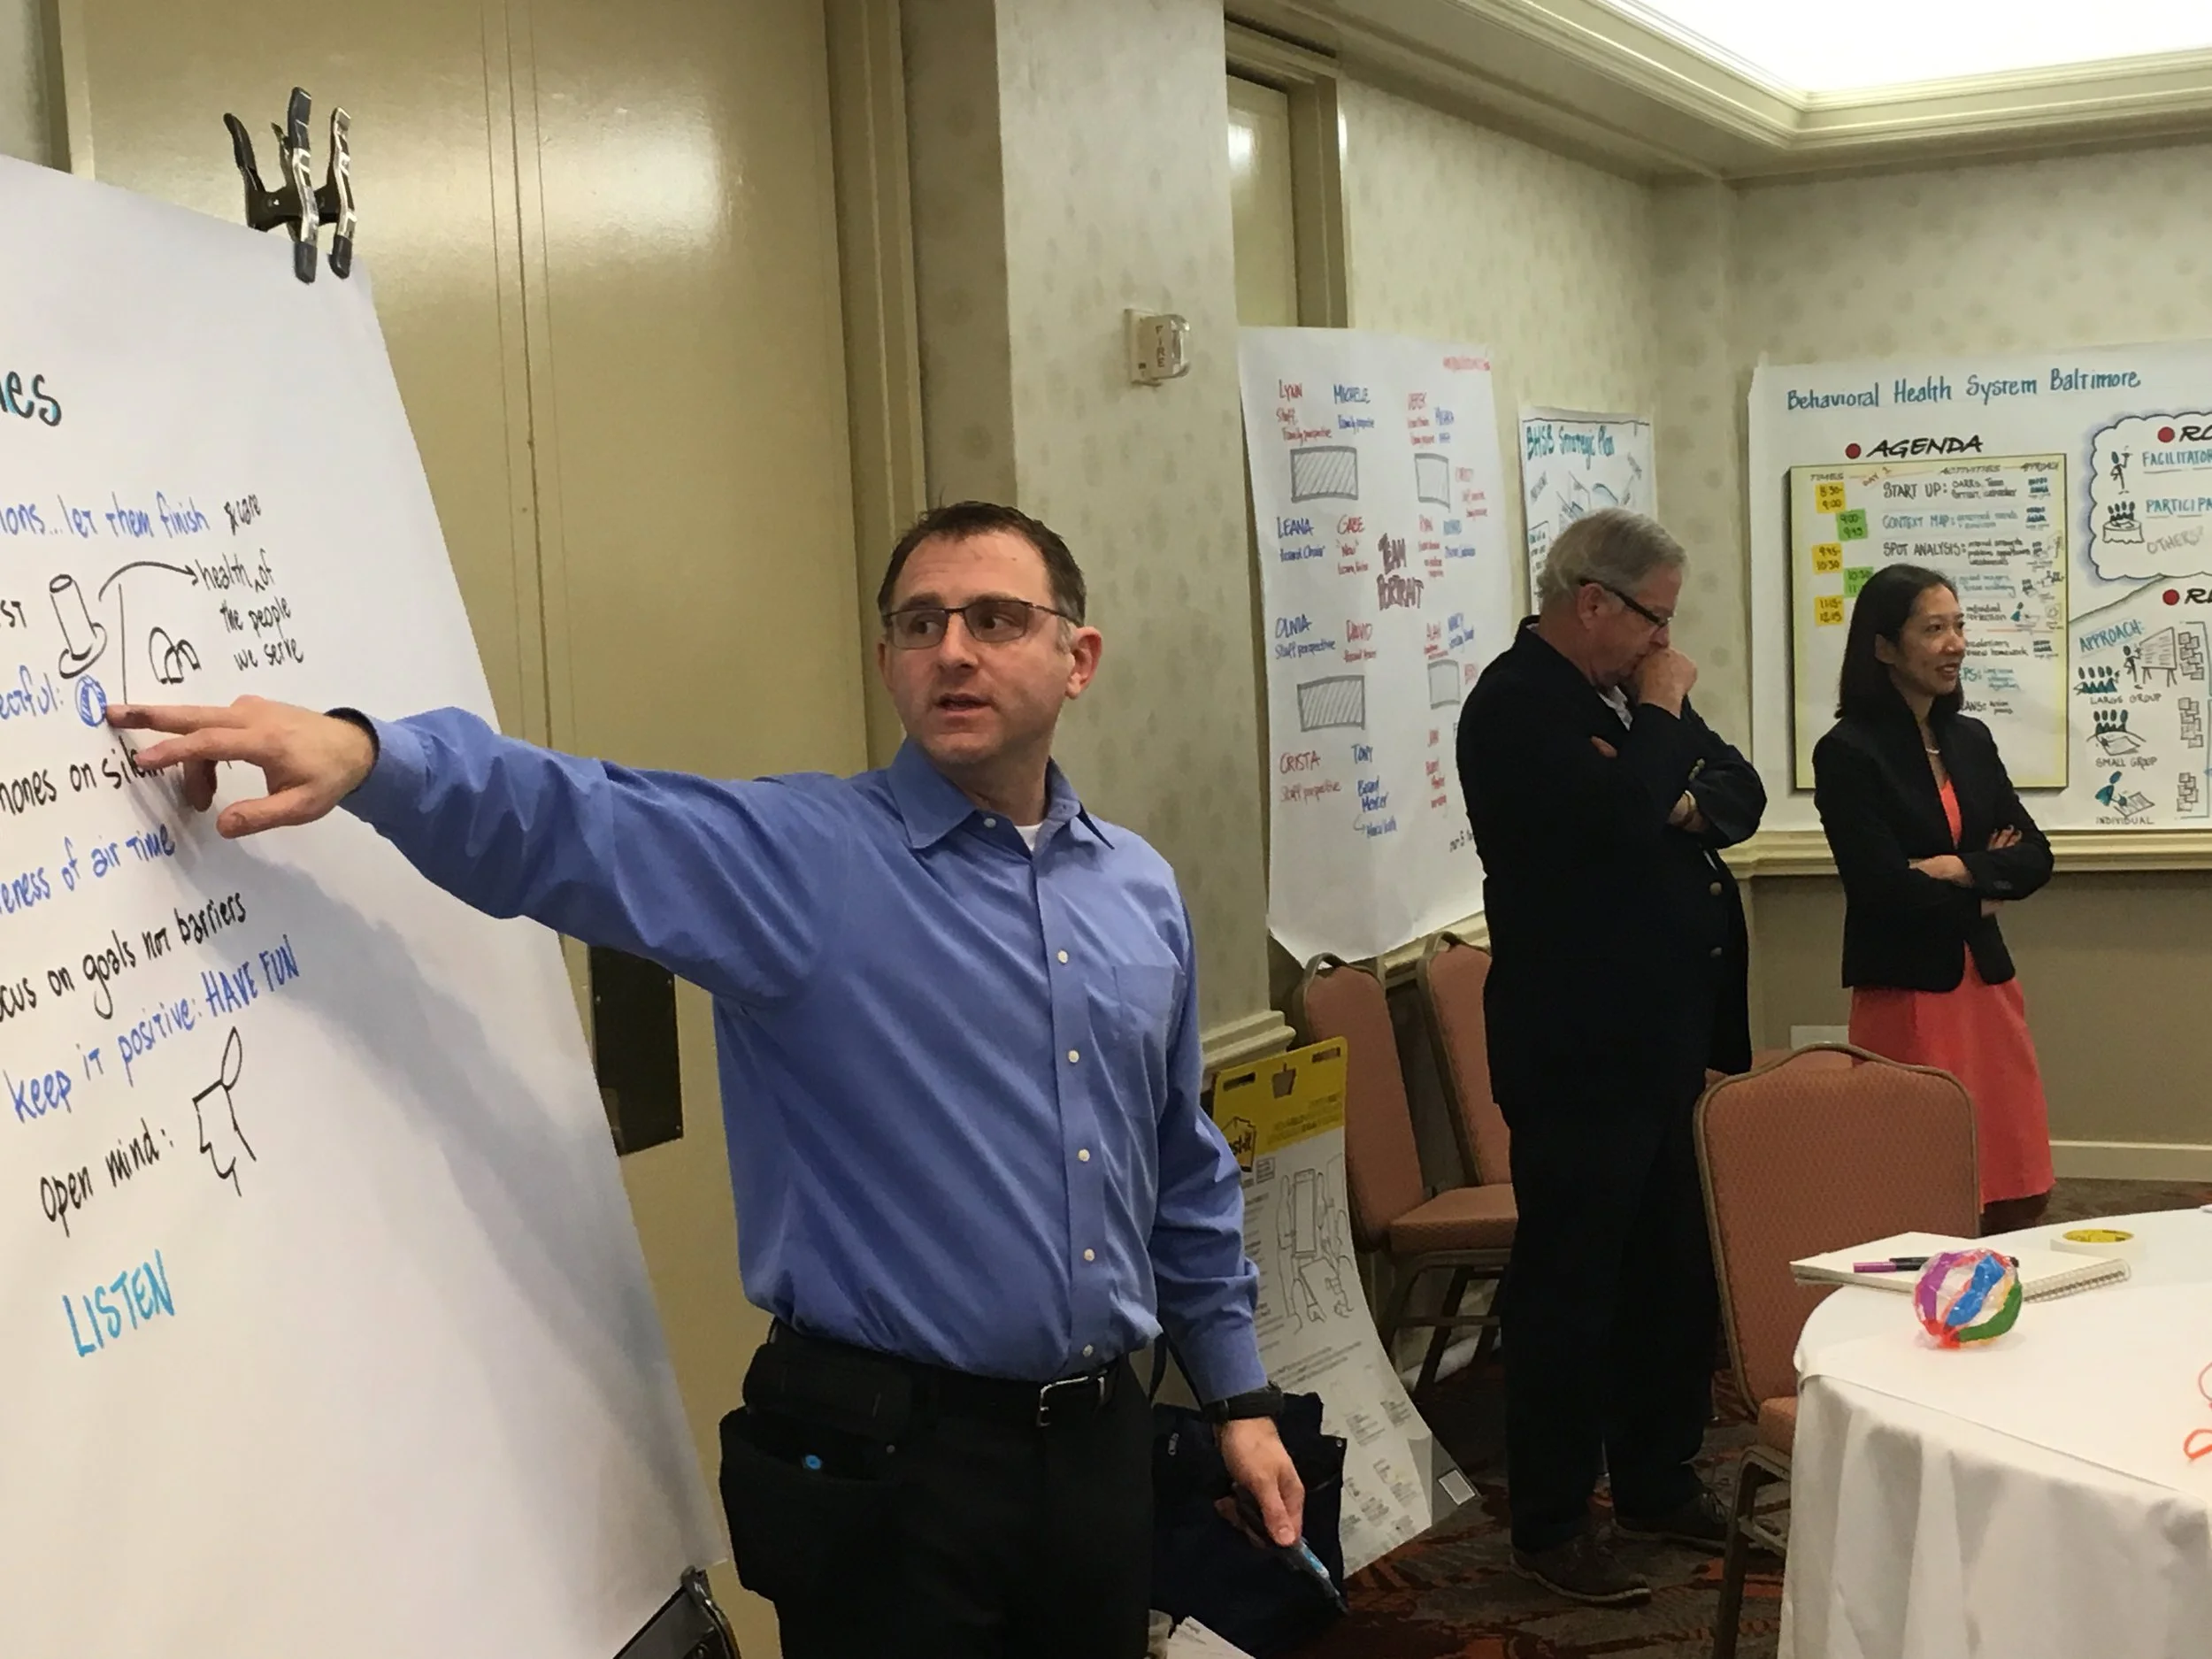
Our work is visual, so it can be tough to describe it to anyone who hasn’t seen it. If I’m trying to describe it as part of a discovery meeting, I will ALWAYS pull up an image of graphic recording or graphic facilitation in context of a group meeting and speak to that.
Sometimes I’ll get asked about the value or return on investment of using visuals. The person who asks this sort of question is likely a strong Sensor (following Myers-Briggs), and so I list the following:
"It has three major benefits. First, studies show that it improves consensus in groups by 22%. Second, it improves retention by 17% just by having it in the room, but it also produces tangible takeaways. I'll scan the charts and email them back to you when we're done. Third, it actually speeds up meeting time by 24%, but usually this translates to being able to cover a lot more material."
(Here's the studies that those numbers come from: http://www.lizardbrainsolutions.com/think-with-ink/2016/3/4/benefits-of-visuals)
When I introduce graphic recording or graphic facilitation prior to a meeting, I typically add: "A couple of rules. First, I'm going to have my back to you. I'm not trying to be rude, I just can't draw over my shoulder. So I may not know who said what, or be able to remember names very well. Second, my markers don't come with spell check. If I get something wrong, just pass me a note or shout at me. Third, this is YOUR PAPER. If you have an idea that you want to sketch out, please jump up and use this paper. That's what it's here for. Often, when participants draw their ideas, that's what really moves the group. And that way, your ideas become part of the record."
